In thousands of metric tons
|
Countries |
Jan |
Feb |
Mar |
Apr |
May |
Jun |
Jul |
Aug |
Sep |
Oct |
Nov |
Dec |
2018 |
2017 |
|
Egypt |
666 |
583 |
668 |
615 |
626 |
642 |
660 |
605 |
669 |
729 |
674 |
670 |
7807 |
6795 |
|
Iran |
2344 |
1819 |
2015 |
2106 |
2153 |
2041 |
1981 |
2062 |
1990 |
2047 |
2187 |
2260 |
25,005 |
21,725 |
|
Libya |
48 |
48 |
30 |
0 |
22 |
36 |
43 |
26 |
13 |
28 |
48 |
50 |
420 |
420 |
|
Morocco |
- |
- |
- |
- |
- |
- |
- |
- |
- |
- |
- |
- |
0 |
370 |
|
Qatar |
233 |
152 |
239 |
233 |
234 |
225 |
224 |
226 |
226 |
205 |
176 |
202 |
2575 |
2644 |
|
Saudi Arabia |
423 |
385 |
385 |
446 |
447 |
460 |
503 |
483 |
399 |
407 |
435 |
468 |
5241 |
4770 |
|
Turkey |
3188 |
3011 |
3382 |
2967 |
3331 |
3032 |
3272 |
3005 |
2935 |
3162 |
3139 |
2886 |
37,310 |
37,525 |
|
UAE |
282 |
202 |
248 |
276 |
299 |
279 |
274 |
265 |
233 |
299 |
298 |
292 |
3247 |
3309 |
|
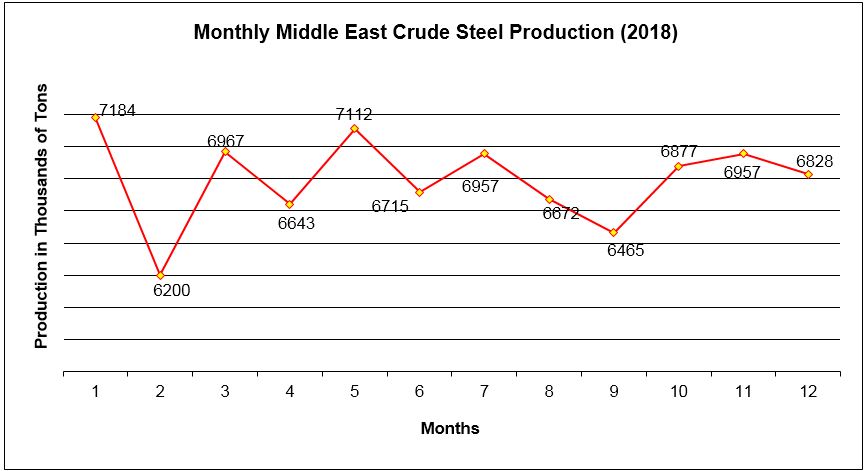
Total |
7184 |
6200 |
6967 |
6643 |
7112 |
6715 |
6957 |
6672 |
6465 |
6877 |
6957 |
6828 |
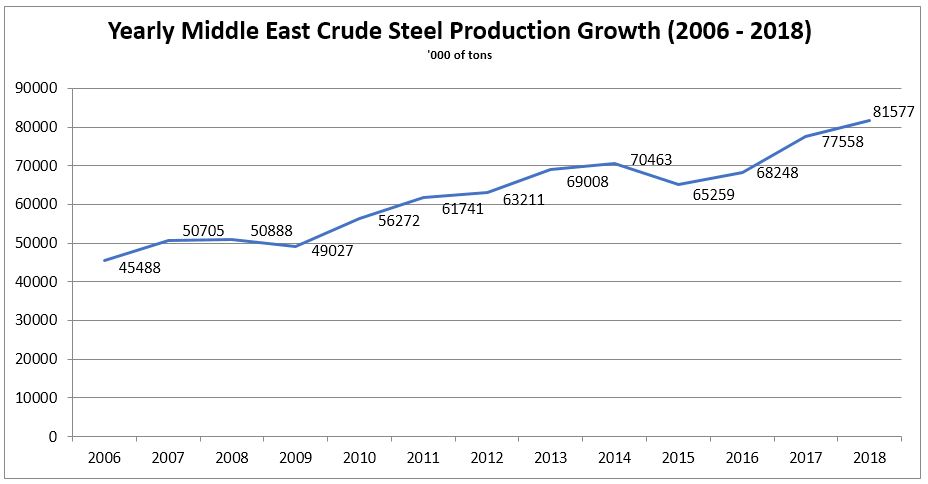
81,577 |
77,558 |

Monthly Middle East Steel Production Difference (December 2017 vs. December 2018)
| Countries |
Dec-17 |
Nov-18 |
Dec-18 |
MoM % |
YoY % |
| Egypt |
659 |
674 |
670 |
-0.59 |
1.67 |
| Iran |
1980 |
2187 |
2260 |
3.34 |
14.14 |
| Libya |
52 |
48 |
50 |
4.17 |
-3.85 |
| Morocco |
- |
- |
- |
- |
- |
| Qatar |
216 |
176 |
202 |
14.77 |
-6.48 |
| S. Arabia |
347 |
435 |
468 |
7.59 |
34.87 |
| Turkey |
3268 |
3139 |
2886 |
-8.06 |
-11.69 |
| UAE |
286 |
298 |
292 |
-2.01 |
2.10 |
| Total |
6808 |
6957 |
6828 |
-1.85 |
0.29 |
Monthly Middle East Steel Production Difference (2017 vs. 2018)
| Countries |
2017 |
2018 |
YoY % |
| Egypt |
6795 |
7807 |
14.89 |
| Iran |
21725 |
25005 |
15.10 |
| Libya |
420 |
392 |
-6.67 |
| Morocco |
370 |
0 |
-100 |
| Qatar |
2644 |
5241 |
2.61 |
| S. Arabia |
4770 |
37310 |
9.87 |
| Turkey |
37525 |
3247 |
-0.57 |
| UAE |
3309 |
3247 |
-1.87 |
| Total |
77,558 |
81,577 |
5.18 |

December
- World - Crude steel production reached 147.084 million tons (Mt) in
October 2018, up by 4.2% over December 2017 (YoY).
- Asia
China - Crude steel production was 76.121 Mt, up by 8.2% YoY.
India - Produced 9.010 Mt, down by 0.6% YoY
Japan - Produced 8.467 Mt, down by 2.9% YoY
- Middle East
Turkey - 2.886 Mt, down by 11.7% YoY
- US - Produced 7.568 Mt, up by 12.4% YoY
- EU
France - Produced 1.132 Mt, down by 6.7% YoY
Italy - Produced 1.655 Mt, down by 7.4% YoY
Spain - Produced 1.085 Mt, up by 6.3% YoY
- Ukraine - Produced 1.885 Mt, down by 0.6% YoY
November
- World - Crude steel production reached 148.6 million tons (Mt) in
October 2018, up by 5.8% over November 2017 (YoY).
- Asia
China - Crude steel production was 77.6 Mt, up by 10.8% YoY.
Japan - Produced 8.7 Mt, down by 0.5% YoY
- Middle East
Turkey - 3.1 Mt, down by 2.1% YoY
- US - Produced 7.4 Mt, up by 11.8% YoY
- EU
France - Produced 1.4 Mt, up by 12.8% YoY
Italy - Produced 2.2 Mt, down by 1% YoY
Spain - Produced 1.3 Mt, down by 0.7% YoY
- Ukraine - Produced 1.7 Mt, down by 11.2% YoY
October
- World - Crude steel production reached 156.6 million tons (Mt) in
October 2018, up by 5.8% over October 2017 (YoY).
- Asia
China - Crude steel production was 82.6 Mt, up by 9.1% YoY.
India - Produced 8.8 Mt, up by 0.4% YoY
Japan - Produced 8.6 Mt, down by 4.5% YoY
- Middle East
Turkey - 3.2 Mt, down by 4.3% YoY
- US - Produced 7.6 Mt, up by 10.5% YoY
- EU
France - Produced 1.3 Mt, down by 3.5% YoY
Italy - Produced 2.3 Mt, up by 1.1% YoY
Spain - Produced 1.3 Mt, down by 7.4% YoY
- Ukraine - Produced 1.8 Mt, down by 6.7% YoY
September
- World - Crude steel production reached 151.7 million tons (Mt) in
September 2018, up by 4.4% over September 2017 (YoY).
- Asia
China - Crude steel production was 80.8 Mt, up by 7.5% YoY.
India - Produced 8.8 Mt, up by 3.7% YoY
Japan - Produced 8.4 Mt, down by 2.4% YoY
- Middle East
Turkey - 2.8 Mt, down by 5.9% YoY
- US - Produced 7.35 Mt, up by 9% YoY
- EU
France - Produced 1.3 Mt, up by 1.4% YoY
Italy - Produced 2.2 Mt, down by 0.8% YoY
Spain - Produced 1.3 Mt, up by 5.1% YoY
- Brazil - Produced 3 Mt, up by 2.5% YoY
August
- World - Crude steel production reached 151.7 million tons (Mt) in
August 2018, up by 2.6% over August 2017 (YoY).
- Asia
China - Crude steel production was 80.3 Mt, up by 2.7% YoY.
India - Produced 8.8 Mt, up by 3.7% YoY
Japan - Produced 8.8 Mt, up by 0.9% YoY
- Middle East
Turkey - 3 Mt, down by 5.7% YoY
- US - Produced 7.5 Mt, up by 5.1% YoY
- EU
Spain - Produced 1.2 Mt, up by 6.6% YoY
Italy - Produced 1.2 Mt, up by 6% YoY
- Ukraine - Produced 1.8 Mt, down by 3.7% YoY
July
- World - Crude steel production reached 154.6 million tons (Mt) in
July 2018, up by 5.8% over July 2017 (YoY).
- Asia
China - Crude steel production was 81.2 Mt, up by 7.2% YoY.
Japan - Produced 8.4 Mt, down by 2% YoY
South Korea - Produced 6.2 Mt, up by 0.1% YoY
- Middle East
Turkey - 3.3 Mt, down by 2.3% YoY
- US - Produced 7.3 Mt, up by 4.5% YoY
- Brazil - Produced 3 Mt, up by 6.7% YoY
June
- World - Crude steel production reached 151.4 million tons (Mt) in
June 2018, up by 5.8% over June 2017 (YoY).
- Asia
China - Crude steel production was 80.2 Mt, up by 7.5% YoY.
Japan - Produced 8.8 Mt, up by 4.2% YoY
India - Produced 8.7 Mt, up by 7.4% YoY
- EU
Italy - Produced 2.1 Mt, up by 1.5% YoY
- Middle East
Turkey - 3 Mt, up by 0.7% YoY
- US - Produced 6.8 Mt, up by 0.8% YoY
May
- World - Crude steel production reached 154.9 million tons (Mt) in
May 2018, up by 6.6% over May 2017 (YoY).
- Asia
China - Crude steel production was 81.1 Mt, up by 8.9% YoY.
Japan - Produced 9.1 Mt, up by 1.8% YoY
India - Produced 8.8 Mt, up by 7.6% YoY
- EU
Italy - Produced 2. Mt, up by 3.7% YoY
- Middle East
Turkey - 3.3 Mt, up by 0.5% YoY
- US - Produced 7.1 Mt, up by 3% YoY
- Brazil - Produced 2.7 Mt, down by 8.6% YoY
April
- World - Crude steel production reached 148.3 million tons (Mt) in
April 2018, up by 4.1% over April 2017 (YoY).
- Asia
China - Crude steel production was 76.7 Mt, up by 4.8% YoY.
India - Produced 8.7 Mt, up by 5.6% YoY
Japan - Produced 8.7 Mt, down by 0.4% YoY
- EU
Italy - Produced 2.1 Mt, up by 3.7% YoY
- Middle East
Turkey - 3 Mt, down by 3.1% YoY
- US - Produced 6.9 Mt, up by 3.6% YoY
- Brazil - Produced 3 Mt, up by 1.9% YoY
March
- World - Crude steel production reached 148.3 million tons (Mt) in
March 2018, up by 4% over March 2017 (YoY).
- Asia
China - Crude steel production was 74 Mt, up by 4.5% YoY.
India - Produced 9.2 Mt, up by 5.3% YoY
Japan - Produced 9.1 Mt, up by 2.2% YoY
- EU
Italy - Produced 2.3 Mt, up by 1% YoY
- Middle East
Turkey - 3.4 Mt, up by 7.6% YoY
- US - Produced 7.3 Mt, up by 5.3% YoY
- Brazil - Produced 3.1 Mt, up by 7.6% YoY
February
- World - Crude steel production reached 131.8 million tons (Mt) in
February 2018, up by 3.5% over February 2017 (YoY).
- Asia
China - Crude steel production was 64.9 Mt, up by 5.9% YoY.
India - Produced 8.4 Mt, up by 3.4% YoY
Japan - Produced 8.3 Mt, down by 0.5% YoY
- EU
Italy - Produced 2.1 Mt, up by 4.53% YoY
- Middle East
Turkey - 3.0 Mt, up by 8.7% YoY
- US - Produced 6.1 Mt, up by 0.4% YoY
- Brazil - Produced 2.7 Mt, up by 5.5% YoY
January
- World - Crude steel production reached 139.4 million tons (Mt) in
January 2018, up by 0.8% over January 2017 (YoY).
- Asia
China - Crude steel production was 67.0 Mt, down by 0.9% YoY.
Japan - Produced 9.0 Mt, up by 0.3% YoY
India - Produced 9.0 Mt, up by 2% YoY
- EU
Italy - Produced 2.0 Mt, up by 5.3% YoY
- Middle East
Turkey - 3.2 Mt, up by 7.6% YoY
- US - Produced 6.8 Mt, up by 2.2% YoY
- Brazil - Produced 2.9 Mt, up by 1.3% YoY
Crude Steel Production Statistics Archive:
2005,
2006,
2007,
2008,
2009,
2010,
2011,
2012,
2013,
2014,
2015,
2016,
2017,
2018,
Other Middle East Production Statistics
Source: World Steel Association