Tunisian steel imports and exports up to 2008
Finished Products
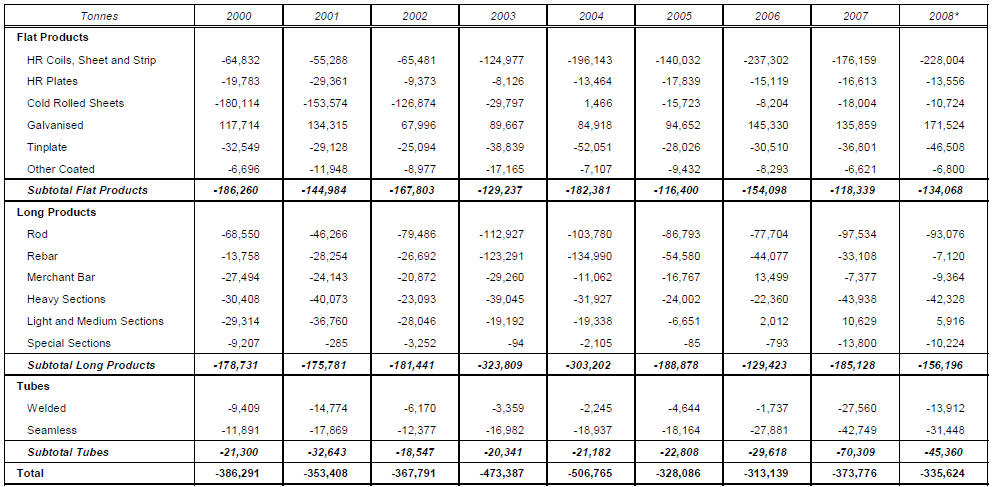
Between 2000 and 2007, Tunisia ran a trade deficit, although this fell slightly from 386,000 tons to 374,000 tons. 2008 is expected to see a deficit of 336,000 tons.
This reflects:
• a slight fall in the flat products deficit
• a decrease in the long products deficit due to an increase in the domestic
production: El Fouladh increased its annual capacity after 2004 from 100,000
tons to 250,000 tons.
• a two-fold increase in the tube deficit.
This change was driven by the increase in exports outstripping the increase in imports over the period. In 2007, the volume of exports was roughly 33% of that of imports.
Trade Balance, 2000 – 2008
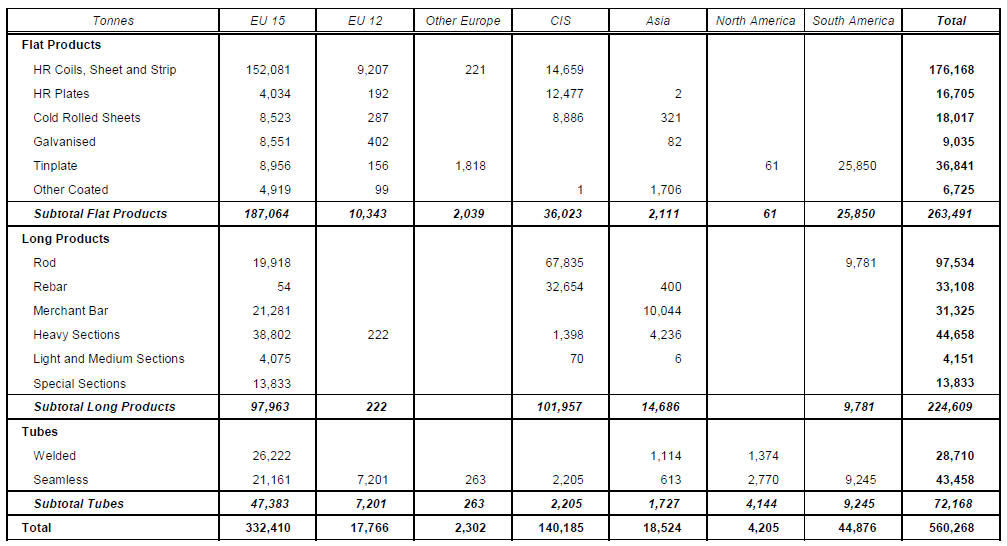
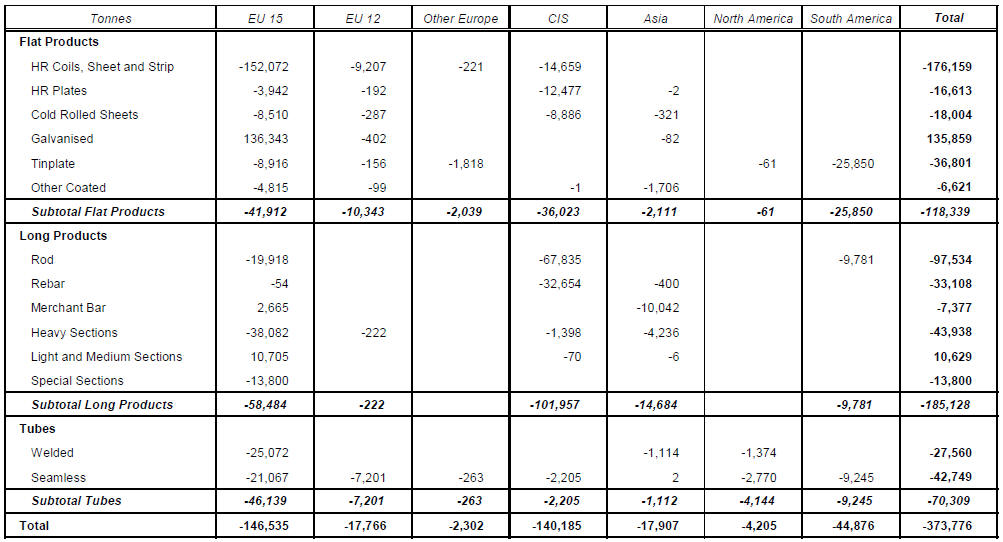
In 2007, EU 15 was Tunisia’s largest trade partner, accounting for all of the country’s exports and 60% of imports. The only other regions of importance were the CIS, which accounted for 25% of imports, and Asia and EU 12 which accounted for around 3% of imports.
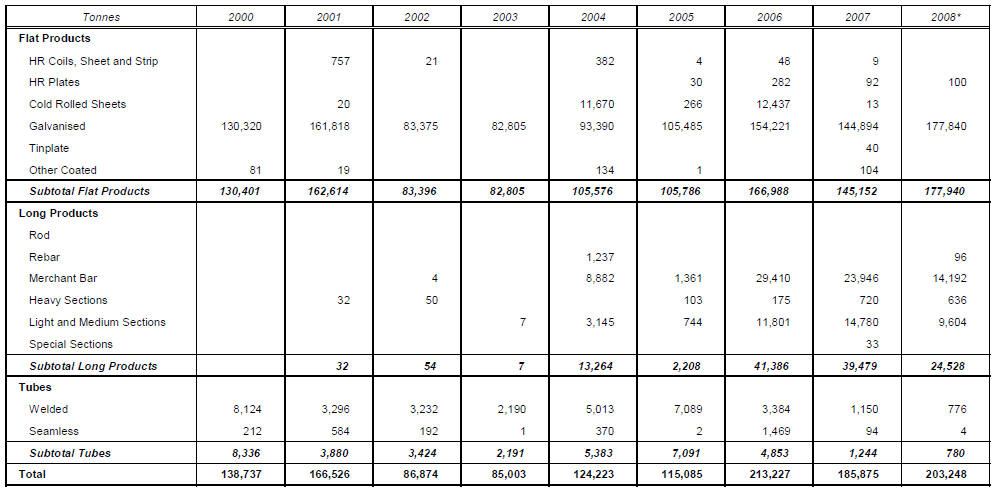
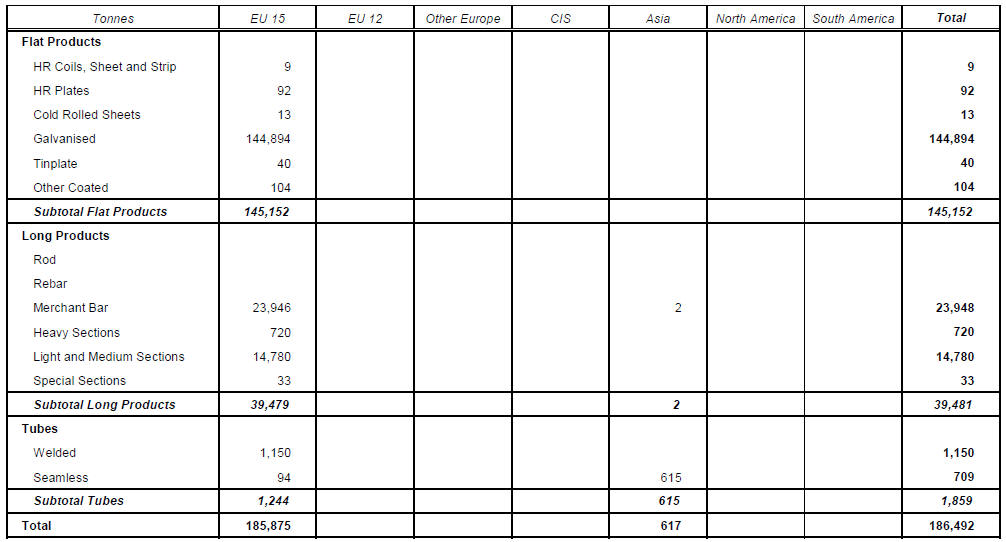
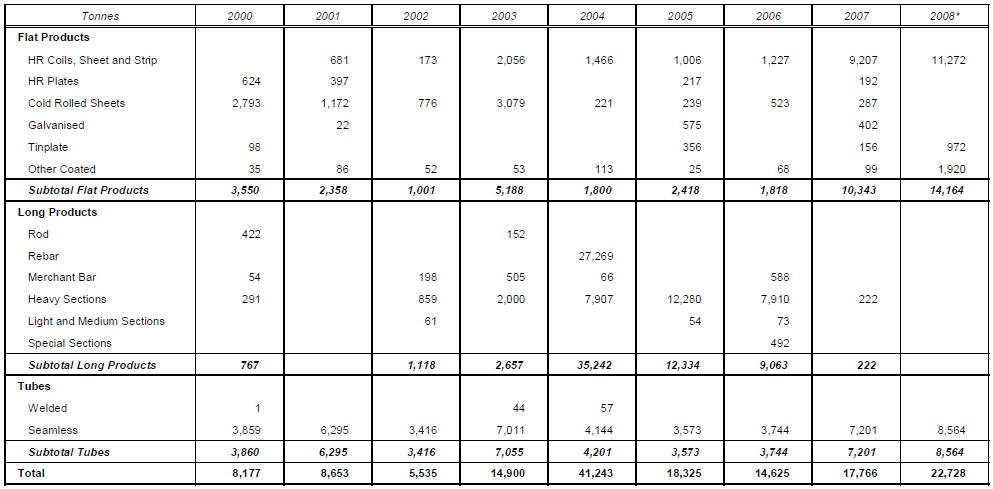
In 2008, Tunisia exported all types of steel, although flat products
dominated with 87%, followed by long products (12%). Tube exports were minimal.
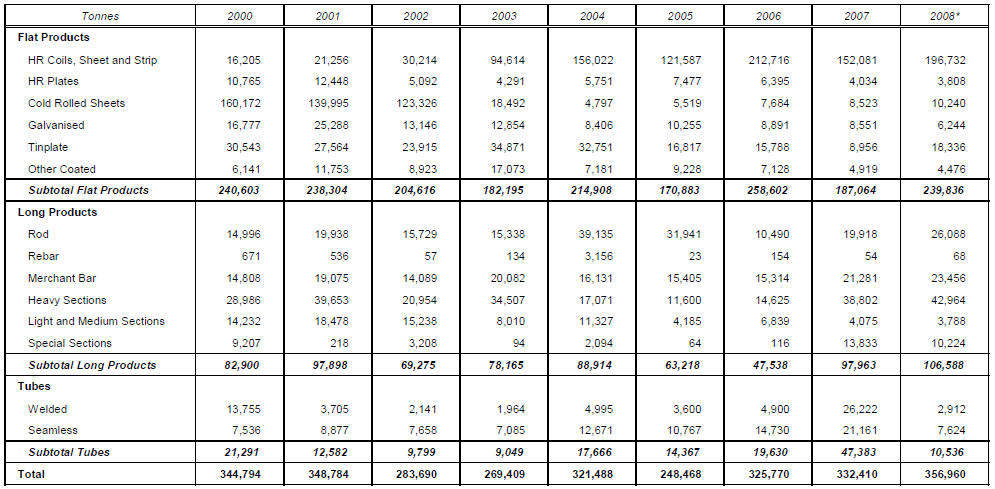
Imports are divided between:
• flat products (58%)
• long products (33%)
• tubes (9%).
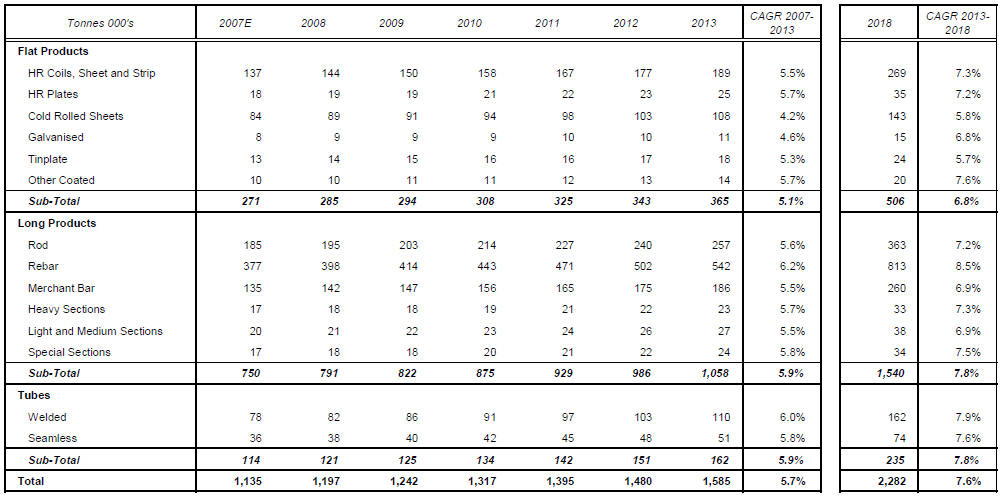
Steel Demand, 2007 – 2013 and 2018
Semis and Raw Materials
Tunisia ran a rising trade deficit in semi finished products between 2000 and 2007, with a slight improvement in 2006. First quarter data indicate, however, that 2008 could see a dramatic improvement.
Between 2000 and 2006, Tunisia ran a small trade deficit in iron ore. However, this moved into a surplus of 128,000 tons in 2007, with a 98,000 tons surplus estimated for 2008, reflecting a surge in exports following closure of El Fouladh’s blast furnace in 2003.
Over the same period, Tunisia was a net exporter of scrap. Between 2000 and 2003, its surplus rose rapidly to some 158,000 tons. However, this moved to a smaller surplus after El Fouladh’s EAF came into operation in 2004, and has stabilised at around 25,000 tons since 2005.
2007 Imports
2007 Exports
2007 Trade Balance
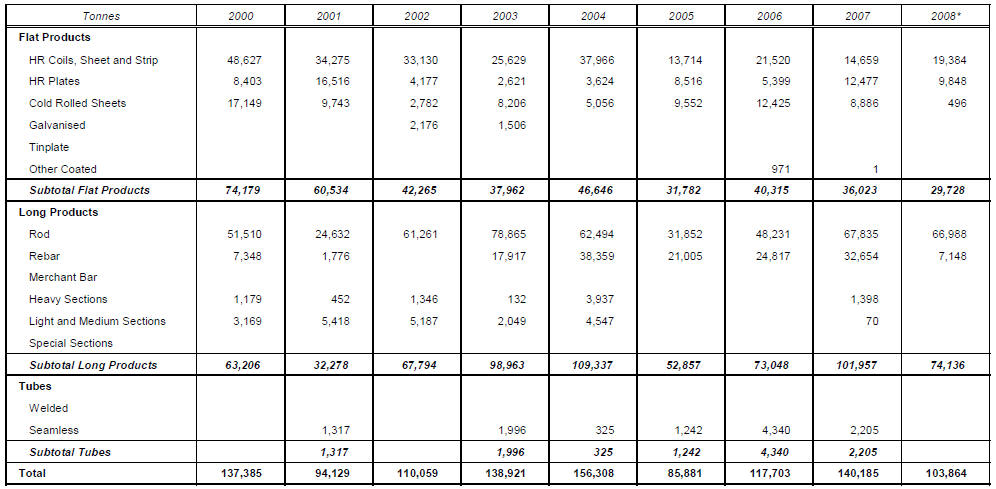
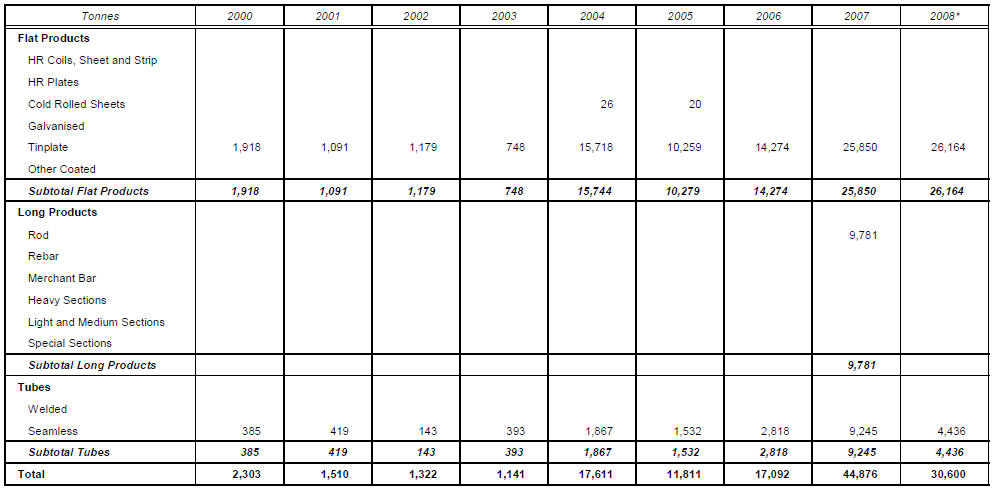
Imports from EU 15, 2000 – 2008*
2008 is an estimate based on data for 3 months
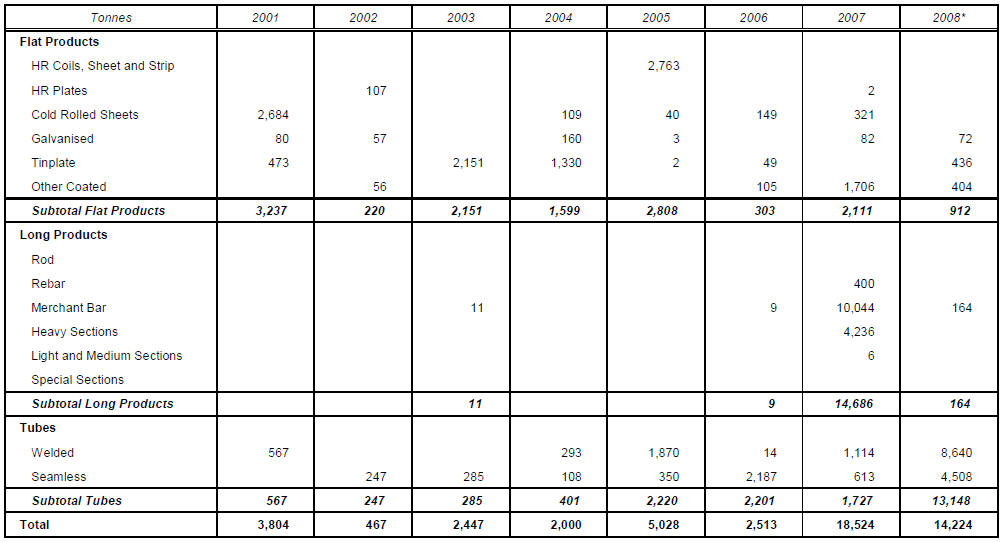
Imports from EU 12, 2000 – 2008*
2008 is an estimate based on data for 3 months
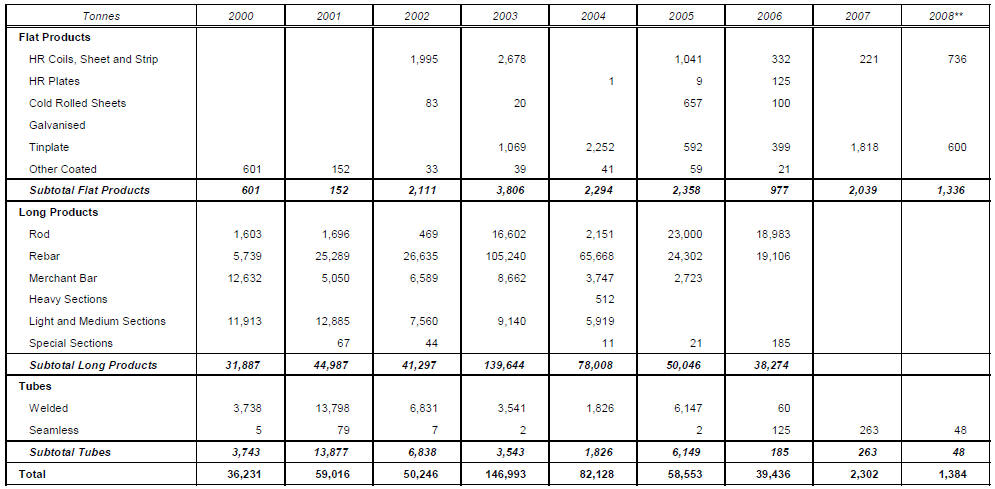
Imports from Other Europe*, 2000 – 2008**
Includes Turkey
2008 is an estimate based on data for 3 months
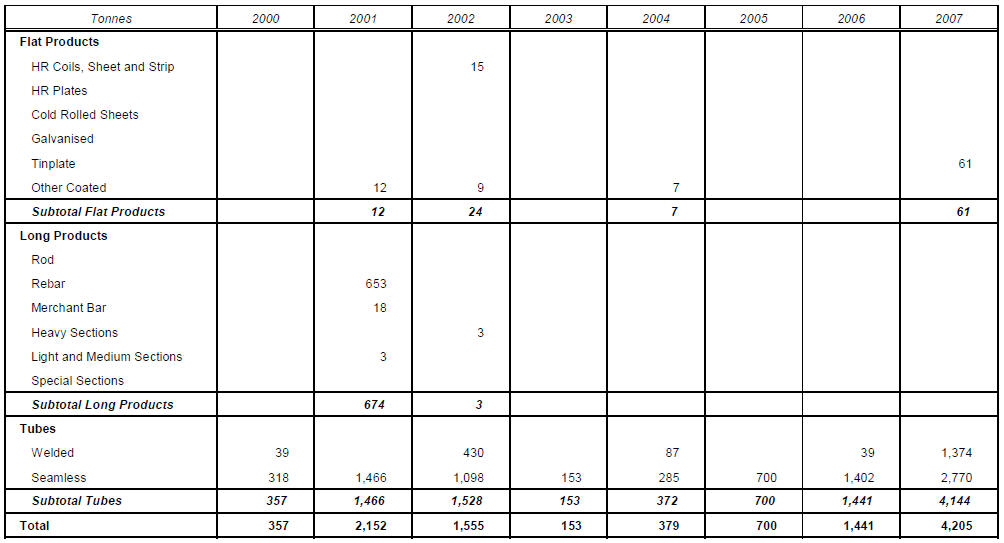
Imports from CIS, 2000 – 2008*
Imports from Asia, 2001 – 2008*
Imports from North America, 2000 – 2007
Imports from South America, 2000 – 2008*
Exports to EU 15, 2003 – 2008*